Vital Agri Nutrients (Pvt) Ltd · Lahore, PakistanVerify a bagFind a dealer+92 42 35762215
VAN — Vital Agri NutrientsProductsCrop PlansMake With UsVAN LabKnowledgeAboutOrder from the plant
◆ Premium range · Potassium

The crop wants more potash than nitrogen.
Pakistan gives it one part in eighty-three.

Measured in the field, sugarcane takes up more potassium than nitrogen — 265 against 220 kilograms per hectare. Across the country as a whole, for every tonne of potash applied, Pakistan applies eighty-three tonnes of nitrogen. That gap is not a preference or a price effect. It is the largest single nutritional deficit in Pakistani agriculture, and it is why crops here lodge, cook in the heat, fill badly and give up their sugar reluctantly.

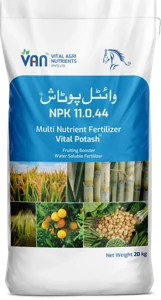
Vital Potash is built for the moment the crop actually needs potassium — its mid-life peak — and carries boron in two forms so the potassium can get in.

N 11%Nitrogen
K₂O 44%Potash
+ BBoron coated
330 g/LSolubility
◈ Boron-coated nitro-potash◈ Fully soluble — fertigation & foliar ◈ Released through VAN's PNAC-accredited laboratory
Vital Potash
2 kg

of potash per hectare — Pakistan's average as reported in 2017, among the lowest in the world. (FAOSTAT puts it at 1.48 kg for 2023; both are on the same floor.) Meanwhile 40% of Pakistani soils are now potassium-deficient, despite mica-rich parent material, through decades of continuous cropping without replacement.

Wakeel, A. & Magen, H. (2017), International Journal of Agriculture & Biology 19(3); Pakistan Fertilizer Statistics.

Home / Our Brands / Potassium / Vital Potash

1 · What the crop asks for, and what the country supplies

The two numbers side by side. This is the whole argument for potash in Pakistan.

What sugarcane takes up
1.2 : 1

kilograms of potassium for every kilogram of nitrogen — measured in the field, not modelled.

VERSUS
What Pakistan applies
1 : 83

one kilogram of potash for every eighty-three kilograms of nitrogen, nationally.

Source · Uptake: Rama Lakshmi, S., Sreelatha, T. & Sireesha, A. (2019), An Asian Journal of Soil Science 14(1&2):67–72. National application: FAOSTAT Fertilizers by Nutrient via Our World in Data (2023). Both ratios derived from the figures shown below.

Nitrogen makes a plant grow. Potassium decides whether that growth turns into anything. It runs the plant's water economy and its stomata, so it governs drought and heat tolerance. It moves sugar from leaf to stalk or grain, so it governs filling and sweetness. It stiffens cell walls, so it governs lodging. A crop given nitrogen without potassium grows tall, soft and thirsty, and then falls over or fails to fill — which is a recognisable description of a great deal of Pakistani farming.

2 · Forty-three years in which nothing changed

The full national record, 1980 to 2023. It is not a story of decline — it is a story of a gap that has never closed.

Nitrogen and potash applied in Pakistan, 1980–2023

Both lines are on the same axis, in the same units. The potash line is not missing — it is the flat one along the bottom.

01M2M3M4M198019902000201020202023Nitrogen, 2023: 3,808,775 tonnes3.81M tNitrogenPotash, 2023: 45,735 tonnes45,735 tPotashtonnes of nutrient applied
Nitrogen Potash
19802023Change
Nitrogen applied843,574 t3,808,775 t4.5 ×
Potash applied9,643 t45,735 t4.7 ×
Potash as a share of all nutrient0.89%0.94%unchanged

Source · FAOSTAT, Fertilizers by Nutrient, via Our World in Data. Full annual series 1961–2023; the chart shows 1980 onward. Shares derived.

Potash use has grown — slightly faster than nitrogen, in fact. But it grew from almost nothing, and it is still almost nothing. Potash was 0.89% of the nutrient Pakistan applied in 1980. In 2023 it was 0.94%. Two generations of farmers, a fivefold increase in fertilizer, and the balance is exactly where it started.

Potash as a share of all nutrient applied — the line that has never moved

Its highest point in forty-three years was 2.6% in 1987, and its lowest was 0.35% in 1996. It is more volatile than it is improving: it fell 61% in a single year between 2021 and 2022, from 77,867 tonnes to 30,508. Potash is imported and priced in dollars, so it is the first thing dropped when money is short — and the last thing bought back.

0%0.5%1%1.5%2%2.5%1980199020002010202020231980: potash was 0.89% of all nutrient applied2023: potash was 0.94% of all nutrient applied0.89%0.94%potash as a share of all nutrient applied

Source · Derived from FAOSTAT Fertilizers by Nutrient via Our World in Data — potash as a percentage of N + P₂O₅ + K₂O applied.

One artefact in the source data, flagged FAOSTAT reports 2017 and 2018 identically for all three nutrients in Pakistan. That is an imputation in the source, not a real plateau, and it is visible as a flat step in both charts. We have left it as published rather than smoothing it, because smoothing someone else's data without saying so is how figures stop being checkable.

3 · What that did to the soil

Applying under 1% while harvesting a full crop every season has one arithmetic consequence.

Every harvest removes potassium from the field. Sugarcane removes more of it than nitrogen. If almost none is put back, the difference comes out of the soil's own reserves — and those reserves are finite even in soil that started rich. Pakistan's parent material is mica-rich, which is why the deficit went unnoticed for so long: the soil had capital to spend, and it has been spending it.

40% of Pakistani soils are now potassium-deficient

Despite mica-rich parent material — through continuous weathering, intensive cropping and nutrient mining without adequate replenishment.

Wakeel, A. & Magen, H. (2017). Potash Use for Sustainable Crop Production in Pakistan: A Review. International Journal of Agriculture & Biology 19(3).

South Asia has run a negative potassium balance for five decades

A regional nutrient budget covering 1970–2018 found a cumulative negative balance of 247 million tonnes of potassium across South Asia — an order of magnitude larger than the nitrogen or phosphorus deficits over the same period.

Pathak, H., Fagodiya, R. K. & Singh, A. (2024). Scientific Reports 14:29136. DOI 10.1038/s41598-024-77134-x.

Being precise about what these two things are The charts above are application data — what was bought and spread, measured and published annually. The soil findings beside them are published research conclusions about the consequence. We have not found, and are not claiming, a measured national time series of Pakistani soil potassium levels from 1980 to today. If one exists we would like to see it. What can be shown is the input record, which is unambiguous, and what the literature concludes follows from it.

4 · Where the potash hunger actually is

Not every crop is equally hungry. Sugarcane is the extreme case, and it is the case that matters most for this country.

Sugarcane — total nutrient uptake, measured across six genotypes

Sugarcane is one of the few major crops that takes up more potassium than nitrogen. It takes up more than four times as much potassium as phosphorus.

Potassium (K): 265 kg per hectare, highest recorded uptake across the genotypes testedPotassium (K)265Nitrogen (N): 220 kg per hectare, highest recorded uptake across the genotypes testedNitrogen (N)220Phosphorus (P): 63 kg per hectare, highest recorded uptake across the genotypes testedPhosphorus (P)63kg per hectare, highest recorded uptake across the genotypes tested
NutrientHighest uptake recordedRelative to phosphorus
Potassium264.99 kg/ha4.2 ×
Nitrogen219.90 kg/ha3.5 ×
Phosphorus62.70 kg/ha1.0 ×

Field experiment at Regional Agricultural Research Station, Anakapalle, 2013-14; six sugarcane genotypes, three early and three mid-late. Figures are the highest uptake recorded across genotypes.

Source · Rama Lakshmi, S., Sreelatha, T. & Sireesha, A. (2019). Nutrient distribution pattern and uptake by different sugarcane genotypes at different growth stages. An Asian Journal of Soil Science 14(1&2):67–72. DOI 10.15740/has/ajss/14.1and2/67-72.

🎋
Sugarcane — the extreme

Takes up more K than N. A long season, an enormous biomass, and sugar that has to be transported from leaf to stalk — every one of those is a potassium job.

🥔
Potato, banana, fruit — close behind

Bulking and fruit-filling crops move large quantities of sugar and water in a short window. Potassium demand is concentrated and unforgiving.

🌾
Wheat, maize, rice — quieter, still real

Lower total demand, but the same dependence at grain filling. Lodging in wheat and poor filling in maize are frequently potassium problems mistaken for nitrogen ones.

5 · When the crop needs it — and why late potash is wasted

This is the finding the product is built around.

Share of season-long uptake already complete by flowering — maize

Four independent field studies, four different answers on the exact number, and complete agreement on the pattern: potassium is taken up early and fast, and is essentially finished by the time the crop flowers. Phosphorus is barely half-taken by the same point.

0%25%50%75%100%Potassium: 66–122% of season-long uptake complete by floweringPotassium66–122%Nitrogen: 65–70% of season-long uptake complete by floweringNitrogen65–70%Phosphorus: 46–50% of season-long uptake complete by floweringPhosphorus46–50%
StudyNitrogenPhosphorusPotassium
Bender et al. (2013)67%46%66%
Hanway et al.65%50%90%
Karlen et al.65%46%88%
Ciampitti et al.70%49%122%

Percentage of season-long uptake completed by the R1 (silking) growth stage. Potassium can exceed 100% because uptake peaks before flowering and then falls as potassium is lost from tissue — which is itself the point: the potassium has to be there early, because later it is leaving, not arriving.

Source · As compiled in Singh, R., Sawatzky, S. K. & Thomas, M. et al. (2023), Agronomy 13(7):1913, reviewing Bender et al. (2013), Hanway et al., Karlen et al. and Ciampitti et al.

The same pattern in a second crop — soybean

Across six site-years and eight varieties, soybean had accumulated 91 to 100% of its season-long potassium by R5.5, against only 68 to 77% of its phosphorus. Half of that potassium then leaves in the stover rather than the seed — a potassium harvest index of 49%, against 81% for phosphorus.

Source · Gaspar, A. P., Laboski, C. A. M. & Naeve, S. L. (2017). Phosphorus and Potassium Uptake, Partitioning, and Removal across a Wide Range of Soybean Seed Yield Levels. Crop Science 57(4):2193–2204.

This is why Vital Potash is a mid-life product. Potash at land preparation is not wasted, and this page is not an argument against it: a crop needs potassium in the ground from the start, and which crop it is changes how much of that early application it can actually use. The argument is about return. If the budget runs to one potash application, it should land where the crop takes up the most and converts the most of it — and the uptake curves above say that is the middle of the crop's life, not the beginning: canopy development and grand growth in sugarcane, booting in wheat, flowering in maize and cotton. Potassium applied after that window has closed arrives too late to be converted at all. A fully soluble product exists so that the dose can be placed at that point, through fertigation or foliar, instead of only at land preparation.

6 · Boron — what we worked out in 2012

EARLY 2012 VAN identified the role of boron in potassium uptake and began developing a coated potash system around it.

Potassium is immobile in soil. It does not travel to the root; the root has to reach it, and the plant has to move it across the root membrane and then around the plant. Boron is directly involved in that traffic — in membrane integrity, in cell wall structure, and in the transport of sugars that potassium governs. A potassium product that ignores boron is relying on a mechanism it has not fed.

That was the insight in 2012, and the answer was to put the boron on the potash granule itself rather than leaving it to a separate application that most growers would never make. But a single boron source will not do the job, for a reason that is pure chemistry.

B-1
Sodium borate — the fast form

Highly soluble and immediately plant-available, so it meets the demand that exists the moment the product dissolves. Its weakness is the same as its strength: being highly soluble it is subject to leaching, and it may be gone before the crop reaches its later requirements.

Covers early-season boron demand, from the moment of application.
B-2
Calcium borate — the slow form

Intermediate to slow release. It stays in place and continues to supply boron through the later part of the season, when the fast form has already leached away. Its weakness is the mirror image: on its own it may not release quickly enough for early demand.

Covers late-season boron demand, when the crop is filling.
B-3
Both forms together

The two failure modes are complementary, so carrying both sources on one granule covers the season from both ends — early availability from the soluble form, sustained availability from the slow one. This is the principle Vital Potash is built on.

Boron present when potassium uptake starts and when it finishes.
B-4
Coated onto the potash

Delivered on the potassium granule rather than as a separate pass. The grower makes one application; the boron arrives in the same place, at the same time, at the same rate as the potassium whose uptake it supports.

One application instead of two, and no missed boron pass.

The behaviour of the two boron forms described above is established soil chemistry and is not specific to any manufacturer. What is ours is the decision to build a potash product around it in 2012, and the coating system that delivers both forms on the granule.

Why the coating matters to the potassium. Potassium moves in the phloem, and phloem loading depends on intact membranes and on the sugar-transport chemistry boron takes part in. A crop short of boron does not move what it takes up as well as one that is not. Coating the boron onto the potash granule puts both at the root at the same time, in the same pass, at the stage the crop is drawing hardest on both — rather than supplying the potassium and leaving the transport question to a separate application that may not happen. That is the design decision behind Vital Potash, and it is a mechanism, not a trial result: VAN publishes no yield figure for it.

7 · The product

Guaranteed analysis & physical form

Nitrogen 11% · K₂O 44%, boron-coated. Solid crystalline powder, light blue. pH 6–7, solubility 330 g/L. Fully soluble, so it will not clog drip emitters or spray nozzles.

Why nitrogen sits alongside the potash

The two macronutrients are taken up together and work together — potassium governs how efficiently the plant uses nitrogen, so supplying them in one product at the mid-life window supports both. It also means one application rather than two at the busiest point of the season.

Application & dosage — where the mid-life window falls, crop by crop

CropStage — the uptake windowDose per acreMethod
SugarcaneCanopy development & grand growth phase10 kg + 10 kgFertigation
MaizeFlowering10 kgFertigation
RiceBooting15–20 kgFertigation
WheatBooting10 kgFertigation
CottonFlowering10 kgFertigation
PotatoTuber initiation & formation10 kg + 10 kgFertigation
Sunflower & oilseedsBefore and at flowering10 kg + 10 kgFertigation
BananaFlowering & fruit formation20 kg + 20 kg + 20 kgFertigation
OrchardsFruit formation20 kgFertigation
Fruiting vegetablesGermination, flowering & fruit formation10 kg × 3Fertigation
Onion & garlicFlowering & bulb formation10 kg + 10 kgFertigation
Leafy vegetablesVegetative growth10 kgFertigation

Doses per acre, from VAN agronomy. Every stage above sits inside the crop's potassium uptake window rather than at land preparation — which is the point of the product. Registered under PS 933-2026, PSQCA manufacturing licence CM/L-4124/2025, packed in 20 kg. The standard and licence match the regulatory register and the pack size matches the specification sheet.

Growing something not listed? The full stage-by-stage programme for 28 crops is in our crop nutrition plans →

The evidence behind this page

How to read the evidence on this page
  • Published field measurements, not our estimates: the sugarcane uptake figures, the maize and soybean uptake timing, and the finding that 40% of Pakistani soils are potassium-deficient. Each is cited on this page with author, year and journal.
  • Established chemistry: the behaviour of sodium borate and calcium borate. This is textbook, not a VAN claim.
  • Ours: the 2012 development work, the decision to build a potash product around boron, and the coating system that carries both boron forms on the granule.
  • Where the trial stands: Vital Potash’s own replicated field trial is still to come. Vital Urea has a published maize trial and a five-site programme behind it; this page carries Vital Potash’s own evidence and nothing borrowed. Ask us where it stands and you will get the current position.

Potash under your own brand?

Vital Potash is available for private label and for licensing, with formulation detail released under NDA through the partner dossier.

Request the dossier →
WhatsApp