
The evidence, and where it runs out.
3 pieces of writing, every figure sourced and dated. Where a number is our own arithmetic on published inputs we say so, and where the data does not exist we say that too.
Pakistan is not short of fertilizer. It is short of nutrition that reaches the crop.
Usage, balance, productivity, and where the nitrogen actually goes. Measured against India, Bangladesh, China and the United States, with every source named.
We have been spending the soil’s capital, not its income.
A harvest is an export. 6 published surveys on where the soil has ended up, and an honest account of the national dataset that does not exist.
A bag is not a dose. How nutrient is delivered is part of the product.
Pivot, drip, drone, broadcast, fertigation and foliar. What each one demands of the product, the 2 field programmes VAN has run of its own, and One Tank, the family built around the 20 litres a drone can carry.
Soil Atlas. 770,160 samples, one province.
770,160 samples across 36 districts, read district by district. Conditions, not mechanism.
Source · Punjab soil testing programme · 36 district workbooks · 770,160 valid samples · c. 2016–2018. Read this before quoting ›
Where the nutrients go after harvest.
The loop that brings nutrients back instead of importing them again.
23 decks, one per product.
A full deck per product. What it is, what it does in the soil, where it fits in the season and what VAN will not claim for it.
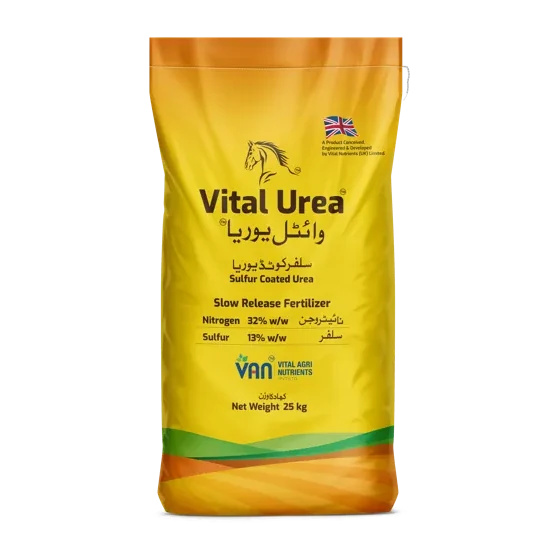
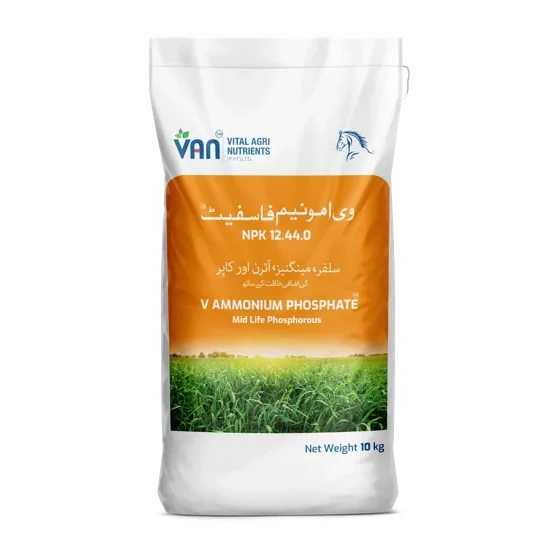
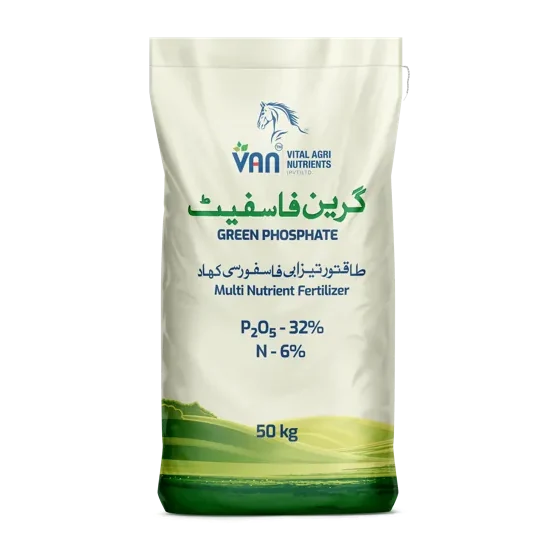
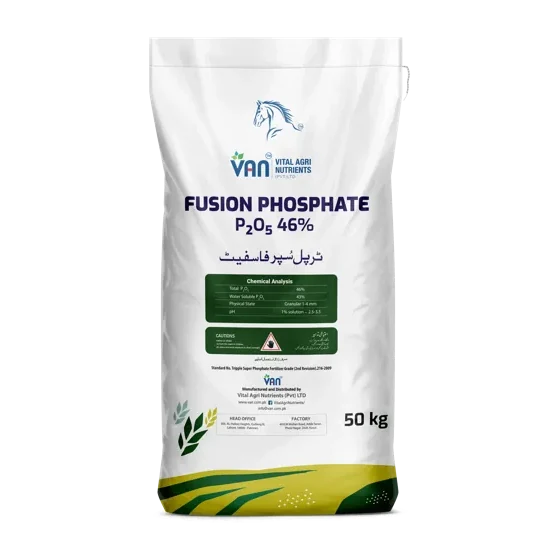
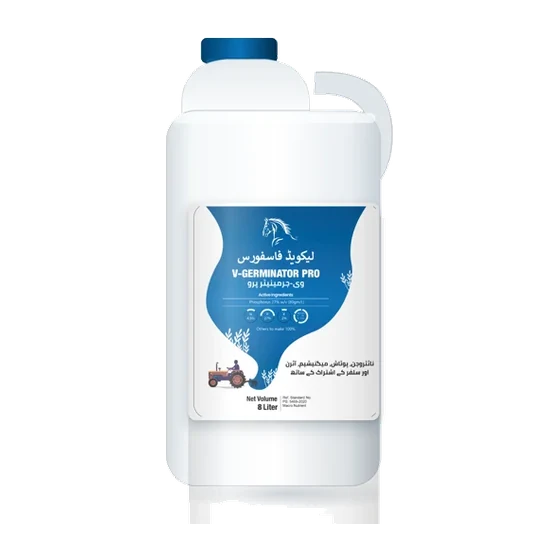
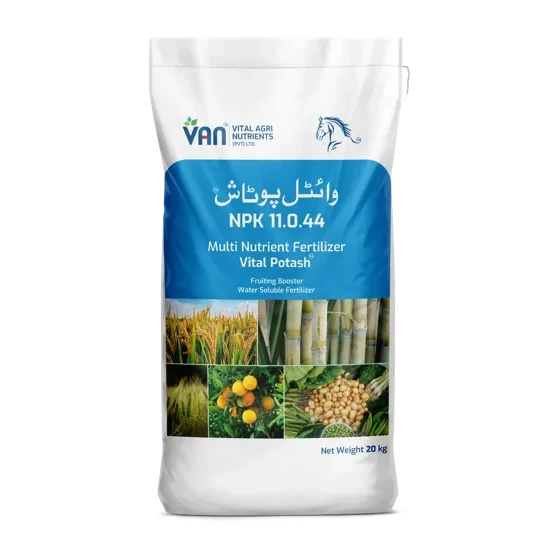
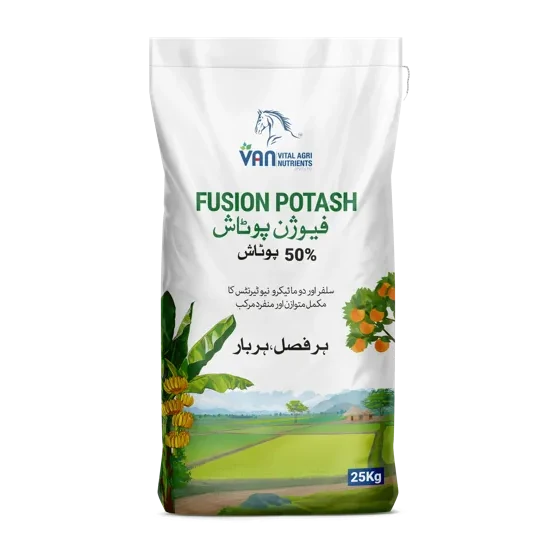
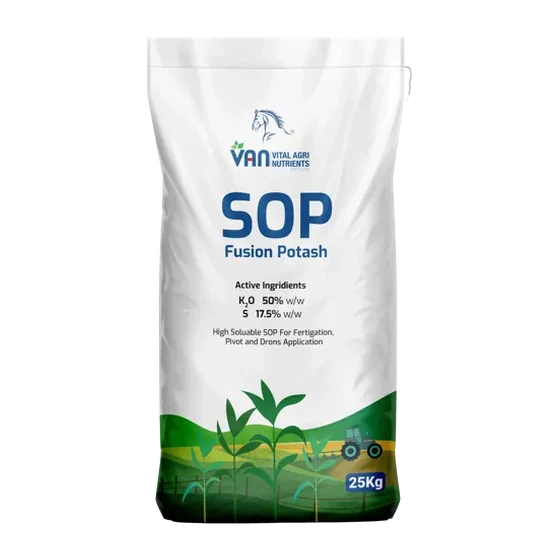
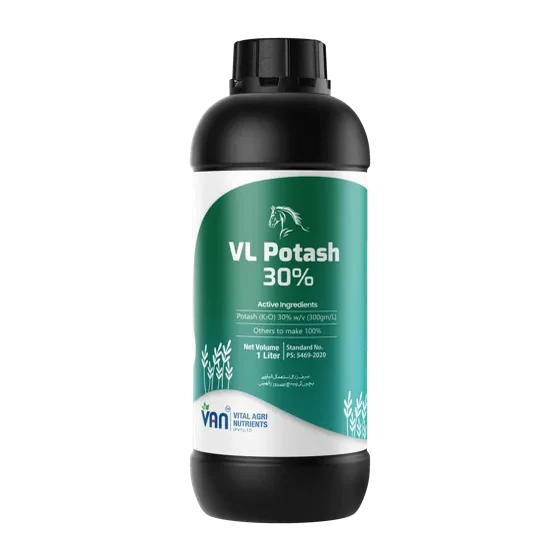
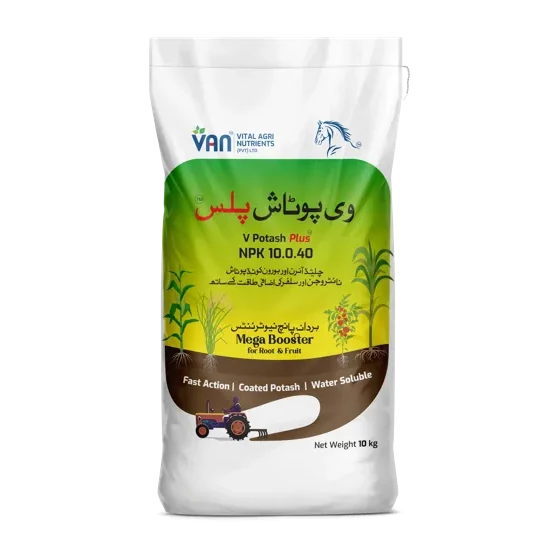
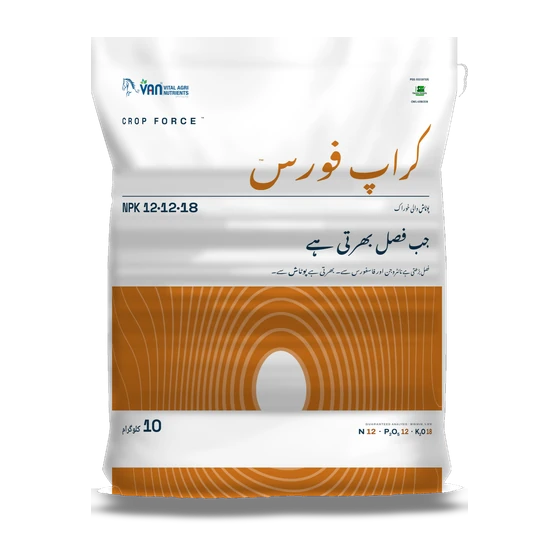
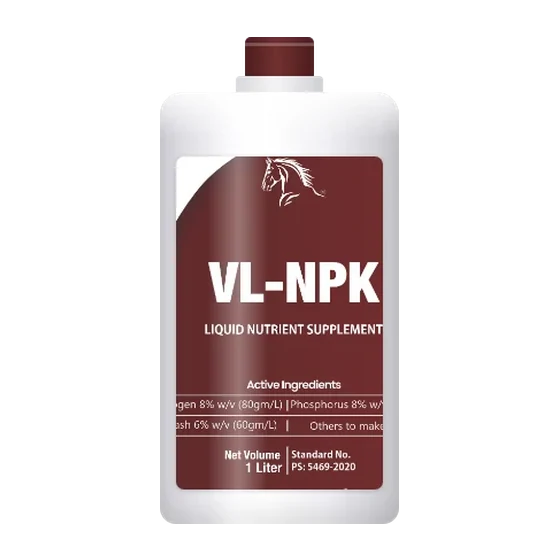
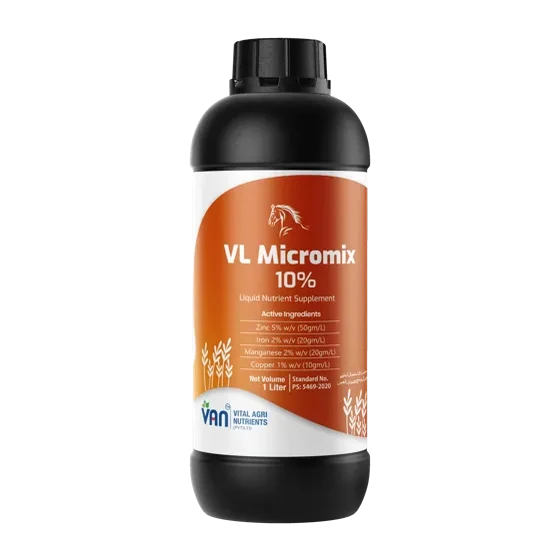
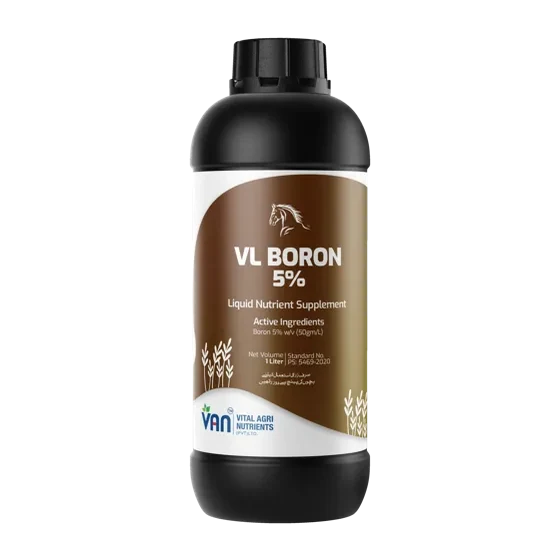
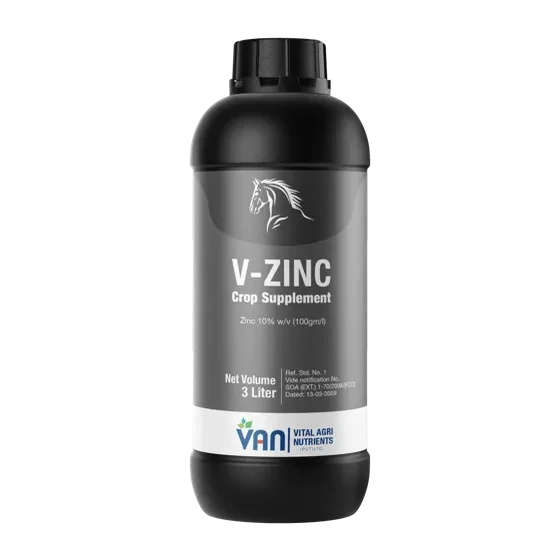
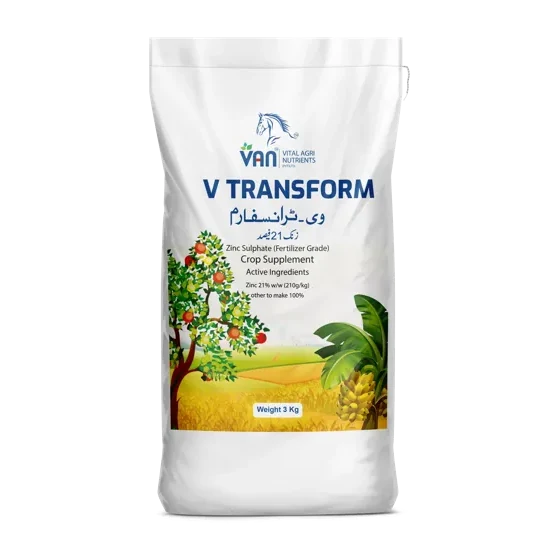
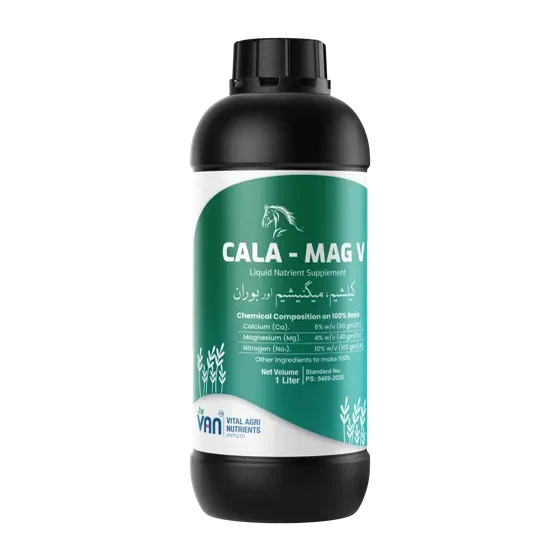
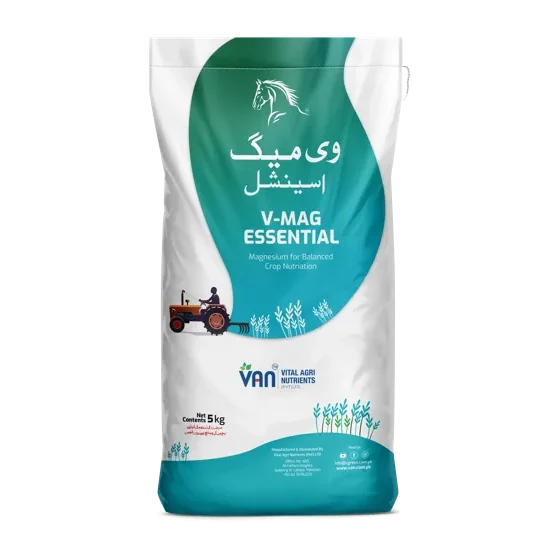
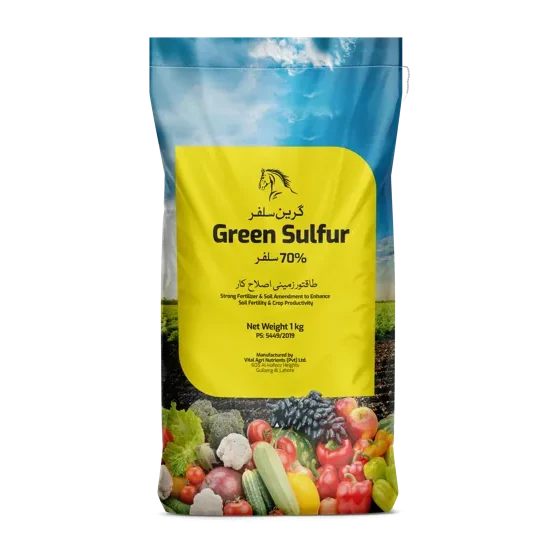
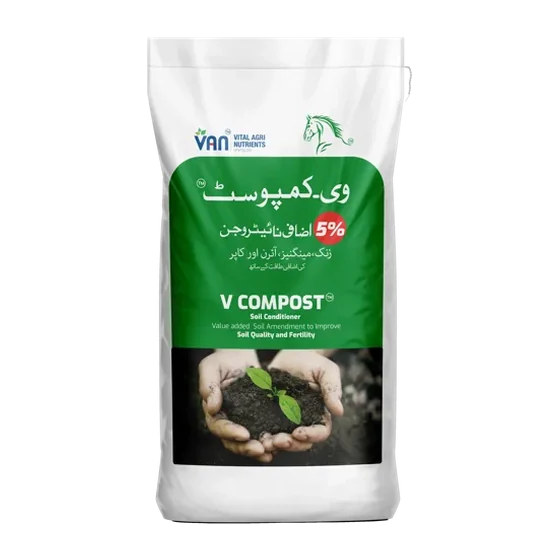
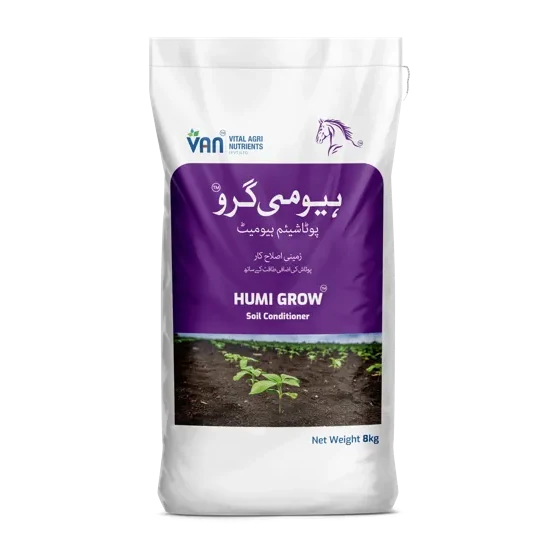
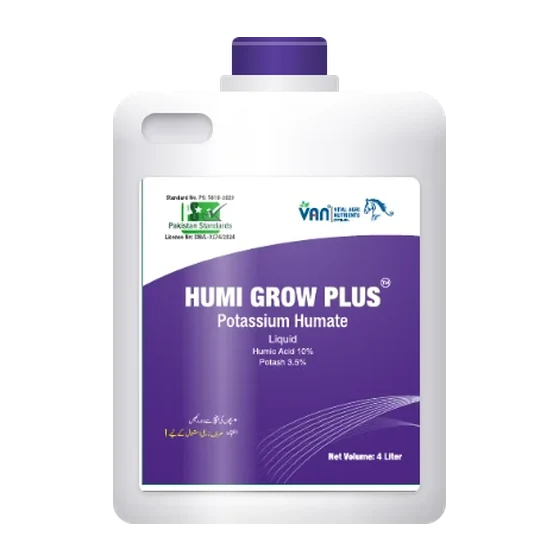
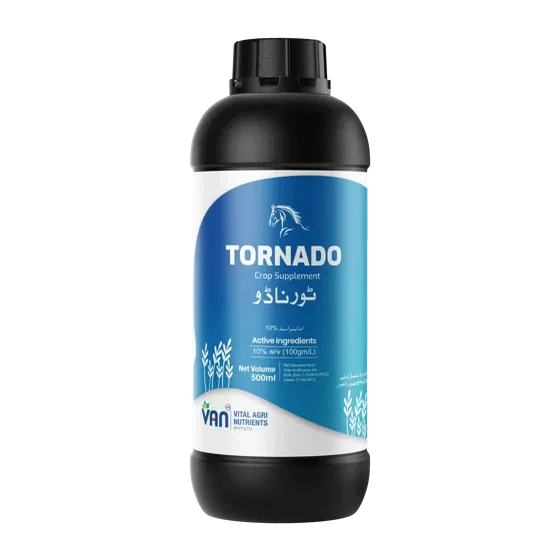
The hub indexes what VAN has already published: 28 crop programmes, 23 products, 28 nutrition plans, 23 technical datasheets and 23 safety data sheets. Datasheet and safety-data links sit on each product page. The crop plans →
Have a question the charts don’t answer?
The agronomy team answers on the same WhatsApp line as everything else.