Above pH 8, part of the nitrogen from urea left on the soil surface is lost to the air as ammonia before the crop can use it. Nitrogen that dissolves can be carried down by the irrigation water and lost to water.
VAN’s explanation
770,160 soil samples from Punjab’s 36 districts, tested in about 2016 to 2018
VAN built these maps from the Punjab soil testing data, so that the condition of the soil can be seen and acted on.
▸ The map shows each of the 8 soil tests in turn, then stops on phosphorus. Choose a soil test, hover over a square to see its district and value, or tap a square to select that district.
The map is divided into squares, each 0.05 degrees across (about 5.5 by 4.8 km). Each square is coloured by the median of the samples taken inside it. Choosing another soil test re-colours the same squares. There are 4,911 squares.
Source · Punjab soil testing programme · 36 district workbooks · 770,160 valid samples · tested in about 2016 to 2018. Read the method and limitations before quoting these figures ›
97.9% of samples had less than 15 ppm of available phosphorus, the lowest level that Punjab’s working thresholds rate as adequate
- Colour scale and median
- Map colours run from rust (3 ppm or less) through gold (7.5 ppm) to green (12 ppm or more). They show differences between squares and are not Punjab’s thresholds. Under Punjab’s thresholds, less than 7 ppm is low and 15 ppm or more is adequate, so a green square can still be below the adequate level. The median was 6.4 ppm: half of Punjab’s samples were below this value.
- Why it matters for the crop
- Inside the plant, phosphorus is used to move energy, and the plant needs it to grow roots. It affects how fast a seedling puts down roots, how many tillers wheat makes, and how well the crop sets and fills its grain. A phosphorus shortage harms the crop most in its first weeks, and phosphorus applied later cannot undo that harm.
- What happens to phosphate in Punjab’s soil
- Punjab’s soil is calcareous: it is rich in calcium carbonate (lime). In calcareous soil, free calcium binds most of the phosphate applied as fertiliser before the roots can take it up.
Sulfur has no map because the survey did not test it. See the list of soil tests below.
In about 2016 to 2018, Punjab’s soil testing programme tested 770,160 samples in 13 soil tests, including pH, organic matter, available phosphorus, available potassium, calcium carbonate and 5 micronutrients. Together, the results describe soil that is alkaline, calcareous and very low in organic matter. For available phosphorus, available potassium, zinc and boron, most samples were below Punjab’s working threshold for ‘low’. Sulfur was not tested.
The large percentage is the share of samples below Punjab’s working threshold for that soil test (above it, for pH). Punjab’s working thresholds are the cut-offs used by Punjab’s soil laboratories to rate a result as low or adequate. The band underneath is the band in which the province median falls on VAN’s 5-band soil-test scale, the scale used on a VAN soil report. The mean is shown beside the median; a few samples with very high values raise the mean. The percentage and the band can disagree for 2 reasons: the percentage counts individual samples while the band describes only the median, and VAN’s bands are set at different levels from Punjab’s thresholds.
Source · Punjab soil testing programme · 36 district workbooks · 770,160 valid samples · tested in about 2016 to 2018. The percentages are shares of samples below Punjab’s working thresholds (above them, for pH and salinity); they are not a diagnosis of any field.
These figures cover Punjab only. All 770,160 samples come from the province’s own 36 district workbooks. Sindh, Khyber Pakhtunkhwa and Balochistan have not been surveyed in this detail. Punjab has most of Pakistan’s cropped area, so its figures are relevant to the national picture, but they are not national figures.
The map shows 8 soil tests in 2 groups: 4 nutrients that a fertiliser can supply (phosphorus, potassium, zinc and boron) and 4 properties of the soil itself (pH, organic matter, calcium carbonate and salinity, measured as electrical conductivity or EC). Choose a soil test above, or in the district table below, to change the map.
All 36 districts, compared on each soil test
Each row is a district and each column a soil test, and every cell is coloured on VAN’s own 5-band soil-test scale. Sort by a column to see which districts are worst on that soil test, search for your own district, or tap a cell to show that district and soil test on the map above.
| 770,160 | ||||||||
|---|---|---|---|---|---|---|---|---|
| 13,330 | ||||||||
| 23,220 | ||||||||
| 16,700 | ||||||||
| 27,063 | ||||||||
| 14,037 | ||||||||
| 17,935 | ||||||||
| 8,536 | ||||||||
| 26,676 | ||||||||
| 28,703 | ||||||||
| 27,501 | ||||||||
| 20,887 | ||||||||
| 12,002 | ||||||||
| 11,963 | ||||||||
| 51,556 | ||||||||
| 24,614 | ||||||||
| 28,233 | ||||||||
| 18,131 | ||||||||
| 10,752 | ||||||||
| 14,757 | ||||||||
| 13,231 | ||||||||
| 25,557 | ||||||||
| 31,103 | ||||||||
| 42,094 | ||||||||
| 23,642 | ||||||||
| 33,871 | ||||||||
| 19,972 | ||||||||
| 9,396 | ||||||||
| 25,164 | ||||||||
| 14,757 | ||||||||
| 21,511 | ||||||||
| 11,092 | ||||||||
| 20,392 | ||||||||
| 31,684 | ||||||||
| 12,869 | ||||||||
| 12,032 | ||||||||
| 25,197 |
How the table is ranked and coloured. “Worst overall” ranks districts by the average of their VAN bands on the 8 main columns (pH, organic matter, P, K, Zn, B, Fe and EC), each column counted equally; cells without a colour band are left out. Tap a column heading to sort by that soil test. Each cell is coloured by the band in which the district median falls on VAN’s 5-band soil-test scale, the scale used on a VAN soil report; the mean is shown under it. Calcium carbonate has no row on that scale, so it has a value but no colour. Copper and manganese have 3 bands on that scale rather than 5. Some values are missing. N.d. means not determined; Jhelum has no valid zinc data. Some values suggest a different laboratory method. * In Faisalabad, Jhang, Chiniot and Toba Tek Singh, the iron values (shown) and the copper values (under “Add Cu · Mn · CaCO₃”) are far lower than elsewhere: copper is lower than in every other district, and iron lower than in most. VAN reads this pattern as the result of a different laboratory method rather than different soil. * Kasur’s phosphorus values are 2.5 to 5 times higher than those of samples within 1 km across the district boundary. Near the Lahore and Okara boundaries the Kasur median is 14.5 ppm, against 4.2 ppm in Lahore and 5.9 ppm in Okara; near the Nankana Sahib boundary it is 16.6 ppm, against 3.2 ppm. All 4 Kasur tehsils show the same pattern of high values. This also suggests a different laboratory method. The starred iron and copper values and Kasur’s phosphorus values are shown as surveyed, without a colour band. Tap any cell to show that district and soil test on the map and in the summary tiles above.
Punjab, all 36 districts
shares of samples, not a diagnosis of any field
share of the samples that have a recorded texture class
Source · Punjab soil testing programme · 36 district workbooks · 770,160 valid samples · tested in about 2016 to 2018. Thresholds: Punjab working thresholds: organic matter low < 0.86%, available P low < 7 ppm (adequate ≥ 15), available K low < 180 ppm, Zn low < 1.0 ppm, B low < 0.5 ppm; EC > 4 dS/m saline.
Pick your district above to see the results inside it
The map also shows the soil below district level. It divides Punjab into 4,911 grid squares of about 5.5 by 4.8 km, roughly 6,500 acres each. Inside a district, the soil in a single square often differs from the district median.
How the soil test results relate to each other, and where an expected relationship does not appear
In the survey, 3 relationships appear clearly: calcium carbonate rises with pH, zinc falls as pH rises, and sandy soil holds less potassium. Phosphorus, which is widely assumed to fall as pH rises, does not fall. Choose how to group the samples and which soil test to compare.
Mean calcium carbonate by pH group · Punjab
The 4 pH groups shown cover 99.9% of Punjab’s samples.
Calcium carbonate rises with pH
Punjab, mean by group · pH 7.0–7.5: 3.41% · 7.5–8.0: 4.86% · 8.0–8.5: 6.91% · 8.5 and above: 7.41% CaCO₃
Mean calcium carbonate rises steadily from each pH group to the next.
Source · Punjab soil testing programme · 36 district workbooks · 770,160 valid samples · tested in about 2016 to 2018. Observational data: they show conditions, not causes.
These are observational survey data, not a controlled experiment. Zinc is highest where calcium carbonate is lowest, but this pattern does not hold across the whole range. Zinc is lower where organic matter is higher, but the survey cannot show why.
Projected soil potassium in Punjab to 2050
This chart shows the model projection of Punjab’s average available soil potassium from the Soil Poverty report, starting from the soil tests of about 2016 to 2018 and coloured by VAN’s soil-test bands. These are projections, not measurements. The average case is the median of the model results. There is a 1 in 10 chance that the real value will be better than the best case, and a 1 in 10 chance that it will be worse than the worst case. Move the year to see the 3 cases.
Punjab soil potassium outlook
If potash fertiliser use in Punjab does not rise, the model projects Punjab’s area-weighted average available soil potassium in 2026 at 116 ppm in the average case (VAN band 3 of 5: Average), 120 ppm in the best case (VAN band 3 of 5: Average) and 102 ppm in the worst case (VAN band 3 of 5: Average). In the average case it falls below 100 ppm, from the Average band into the Weak band, around 2036. In the best case this happens around 2044, and in the worst case around 2027.
Average available soil potassium in Punjab (ppm), projected by a model that starts from the 770,160 soil samples tested in about 2016 to 2018. The coloured bands are VAN’s own soil-test scale, the one used on a VAN soil report: Critical under 50 ppm, Weak 50 to under 100, Average 100 to under 150, Moderate 150 to 200, Healthy above 200. A value below 100 ppm falls in the Weak band. The values at the right-hand end of the lines are for 2050.
Source: Tahir Abbas, Soil Poverty Series No. 1, Punjab’s Potash (2026). The projection starts from 130 ppm, the average of about 2016 to 2018 weighted by cultivated area. The Atlas weights by number of samples instead, which gives a median of 126 ppm and a mean of 132 ppm. The model takes the yearly loss of available soil potassium from the loss measured at monitoring sites of the Soil Fertility Research Institute (SFRI) in 2003-09. All values in this chart are model projections.
The survey ran the same 13 soil tests in every district and did not test for sulfur
Crops need sulfur to turn applied nitrogen into grain protein. Because the survey did not test for sulfur, it cannot show whether sulfur is deficient in Punjab’s soils.
The 13 soil tests in the survey, and sulfur, which was not tested
province meansSulfur was left off the testing schedule, so the survey has no result for it. Because sulfur was not measured, the survey could not report a sulfur deficiency, and fertiliser plans based on the survey could not include sulfur.
VAN’s wheat crop plan recommends applying Green Sulfur twice: at germination and at early growth.
Source · Punjab soil testing programme · 36 district workbooks · 770,160 valid samples · tested in about 2016 to 2018. Copper, iron, manganese and saturation percentage are province means from the same survey. Texture is the share of the most common recorded class among the 757,563 samples that have a texture class; the other 12,597 of the 770,160 samples have none and are not counted.
What VAN supplies for each soil condition
Each soil condition below is a survey finding. What the condition does to the nutrient is VAN’s explanation from soil science, not a finding of the survey.
Punjab’s soil is calcareous: it is rich in calcium carbonate (lime). In calcareous soil, free calcium binds most of the phosphate applied as fertiliser before the roots can take it up.
VAN’s explanation
In 2023, Pakistan applied 83 kg of nitrogen for every 1 kg of potash (as K₂O). Because so little potash is applied compared with what crops remove, crops take most of their potassium from the potassium already in the soil.
VAN’s explanation, from FAO national data
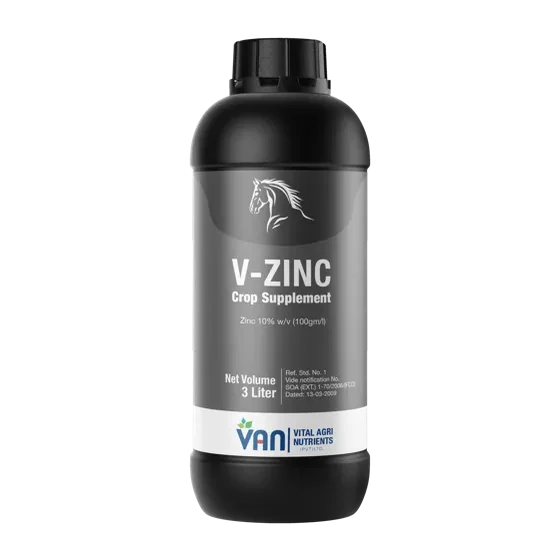
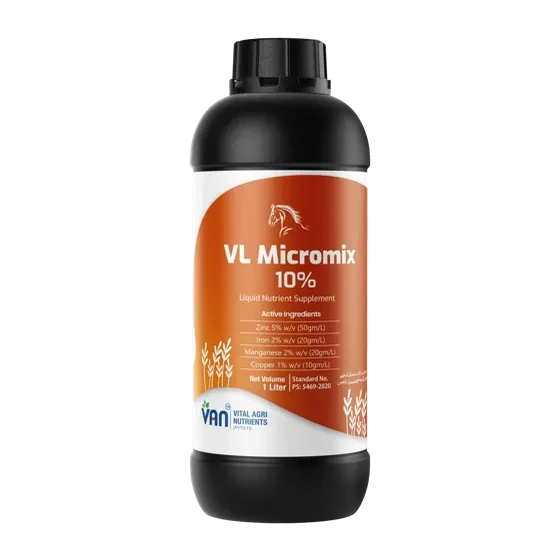
In Punjab’s alkaline soils, zinc is held in chemical forms that roots cannot take up, even when the total zinc in the soil is adequate.
VAN’s explanation
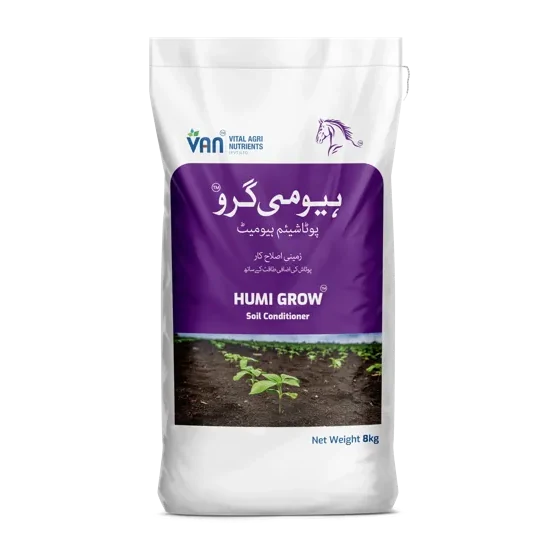
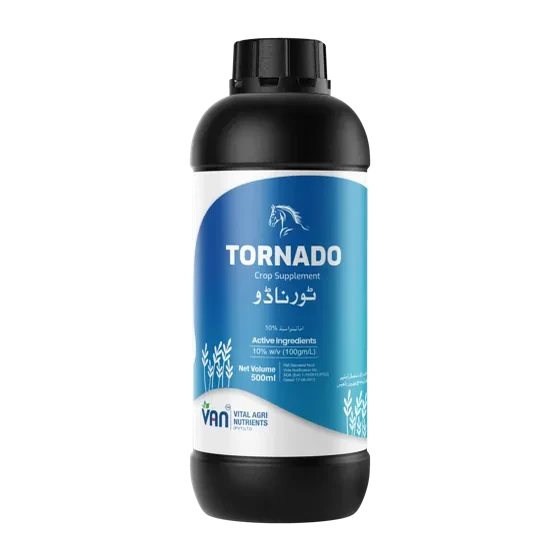
Organic matter holds nutrients and water in the soil. Soil with less than 1% organic matter can hold very little of either. VAN’s humate products are made for soils under 1% organic matter.
VAN’s explanation
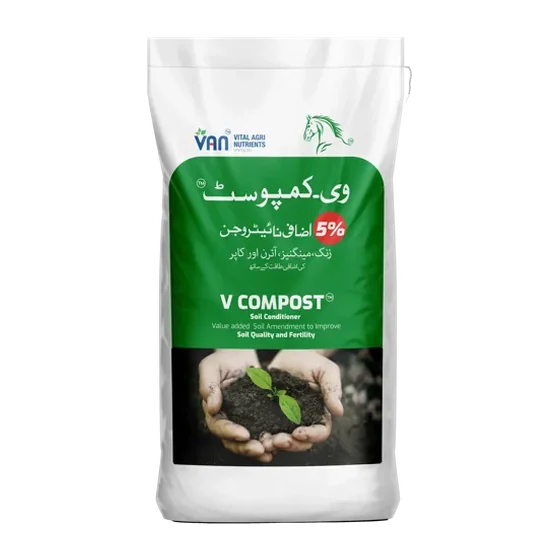
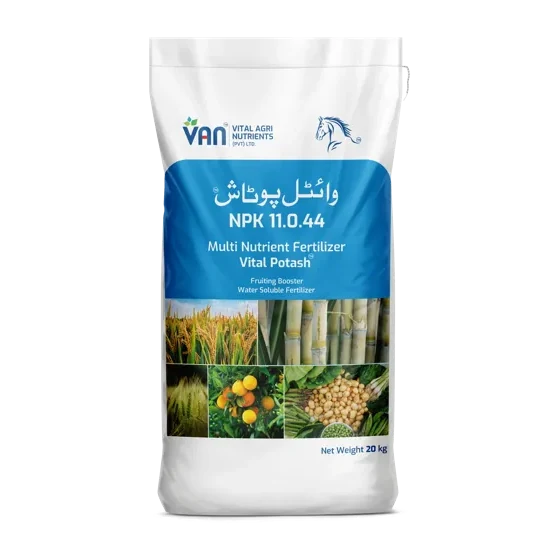
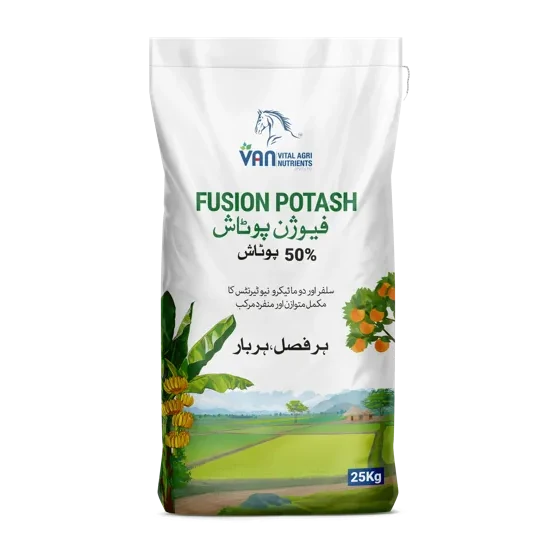
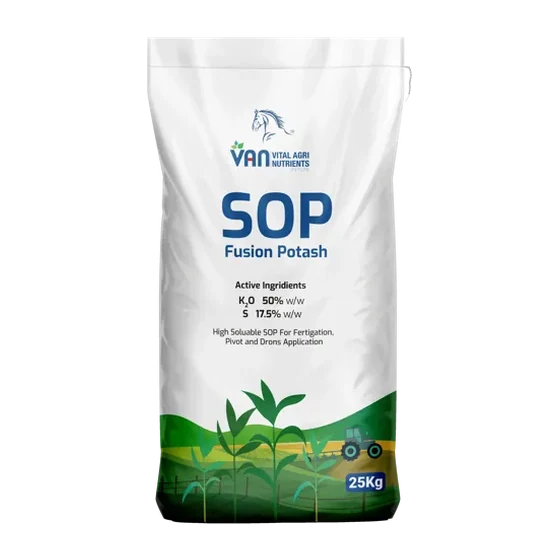
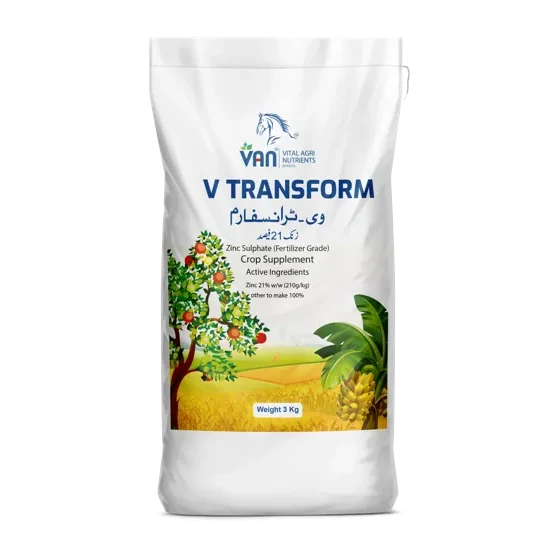
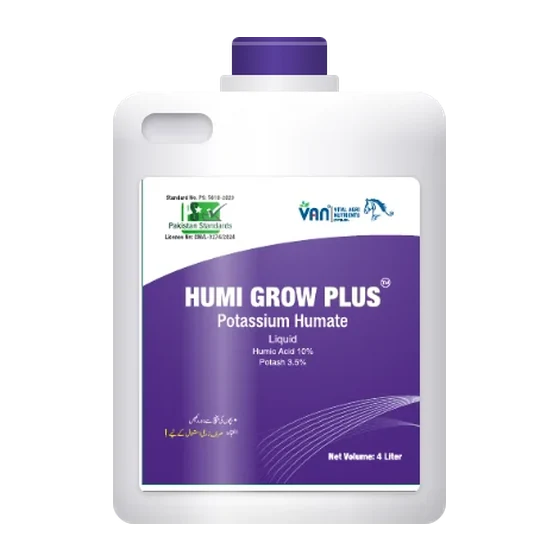
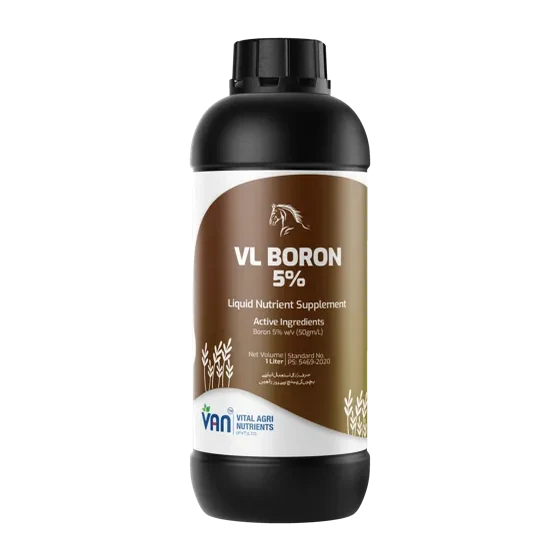
More than half of Punjab’s samples were low in boron, but the margin between enough boron and too much boron is small, so the dose has to be measured carefully. VAN supplies boron as a coating on Vital Potash granules, as part of Fusion Potash, and on its own as VL-Boron.
VAN’s explanation
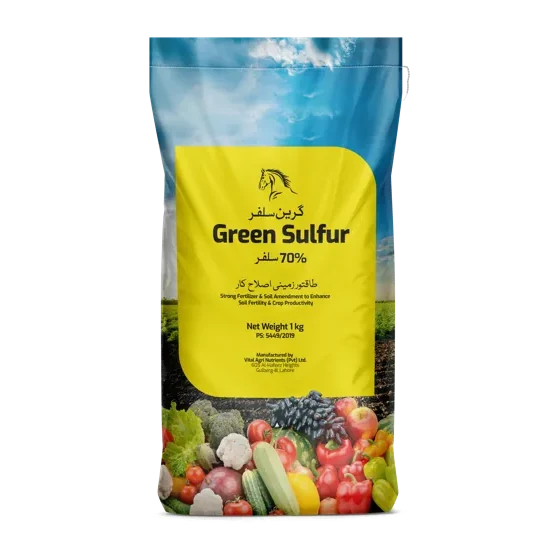
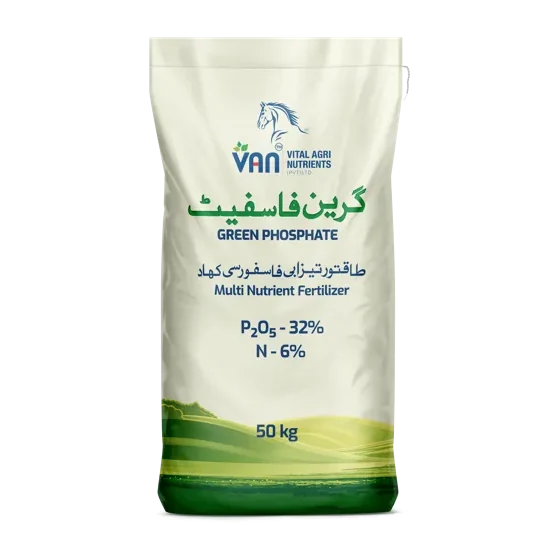
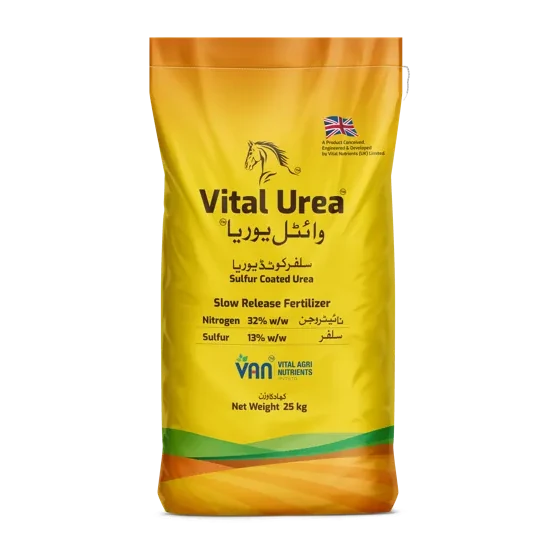
The survey did not test sulfur. VAN supplies sulfur in Vital Urea (sulfur coated urea, S 13% minimum) and in Green Sulfur (sulfur 70%, water-dispersible granules).
VAN’s products
Condition figures: Punjab soil testing programme · 36 district workbooks · 770,160 valid samples · tested in about 2016 to 2018.
Nutrient applied per acre of arable land in Pakistan rose by 68% from fiscal year 1999-2000 to 2023-24, while wheat yield rose by 31%
Across Pakistan, nutrient applied per acre of arable land rose by 68% from 1999-2000 to 2023-24, while wheat yield rose by 31% over the same period. Pakistan’s nitrogen use efficiency was 29% in calendar year 2023: of every 100 kg of nitrogen added to cropland, about 29 kg were taken out in the harvested crop. In VAN’s view, Punjab’s alkaline, calcareous soil is 1 of the reasons why more fertiliser has not brought a matching rise in yield. In the survey of about 2016 to 2018, 96.1% of samples were above pH 7.5, and the mean calcium carbonate content was 6.53%.
Sources · nutrient per acre of arable land 1999-2000 to 2023-24: World Bank; wheat yield: Pakistan Economic Survey; nitrogen use efficiency: FAOSTAT, Cropland Nutrient Balance, December 2025 release (2023).
On Punjab’s alkaline, calcareous soil, VAN considers that the form of the fertiliser and where it is placed have more effect on how much nutrient reaches the crop than the quantity applied.
The national figures and their sources →The model projects that Punjab’s area-weighted average available soil potassium will fall below 100 ppm around 2036 in the average case, 2027 in the worst case and 2044 in the best case
This report by Tahir Abbas uses the Atlas data to estimate how much potash (as K₂O) 5 crops remove from Punjab’s soil each year, how much fertiliser, manure and irrigation water return to the soil, and when Punjab’s area-weighted average available soil potassium is projected to fall below 100 ppm if potash fertiliser use in Punjab does not rise.
Read the report →Method and limitations
The data are 36 district workbooks from the Punjab soil testing programme. Each row is 1 georeferenced sample, with district, tehsil, markaz, union council and mauza identifiers alongside the laboratory results. Every row was read, with no sub-sampling. Records without a valid pH were excluded, leaving 770,160 samples. Province figures are weighted by the number of samples in each district.
The samples were tested in about 2016 to 2018. The figures describe the soil as it was then; the soil may have changed since.
These are survey data, with no controlled treatments. They establish soil conditions with very high confidence, but they cannot show what causes them; for causes, controlled and peer-reviewed studies are the appropriate evidence.
Punjab’s working thresholds are the cut-offs used by Punjab’s soil laboratories to rate a result as low or adequate. Deficiency shares use them: organic matter below 0.86%, available phosphorus below 7 ppm (adequate at 15 or more), available potassium below 180 ppm, zinc below 1.0 ppm, boron below 0.5 ppm.
1 column in the Sheikhupura workbook was repeated by mistake; it was corrected before the figures were worked out. Jhelum has no valid zinc data. Physically impossible values were limited to the ranges listed below before medians and means were worked out.
Limits applied before medians and means were worked out: pH 0–14, OM 0–10%, P 0–200 ppm, CaCO₃ 0–100%, K 0–3000 ppm, Zn 0–50 ppm, B 0–20 ppm, EC 0–100 dS/m.
770,160 valid samples across 36 districts. Soil tests: Saturation percentage · Texture class · Electrical conductivity · pH · Organic matter · Phosphorus (available) · Potassium (available) · Calcium carbonate · Zinc · Copper · Iron · Manganese · Boron. Not tested: Sulfur.
Why your own field needs its own soil test
The Atlas shows district medians of samples tested in about 2016 to 2018. VAN bases a plan for your own field on an analysis of your soil. Ask for a plan on WhatsApp, or send 500 g of soil to Sample Reception.